From Data Overload to Strategic Clarity
In today's business landscape, data is no longer a back-office asset—it is the foundation of every strategic move. Yet many organizations still struggle with scattered reports, inconsistent templates, and insights that arrive too late to guide real decisions. Our Data & Analytics service helps companies break this cycle by converting raw information into dashboards that are accurate, real-time, and truly useful for the teams who rely on them every day.
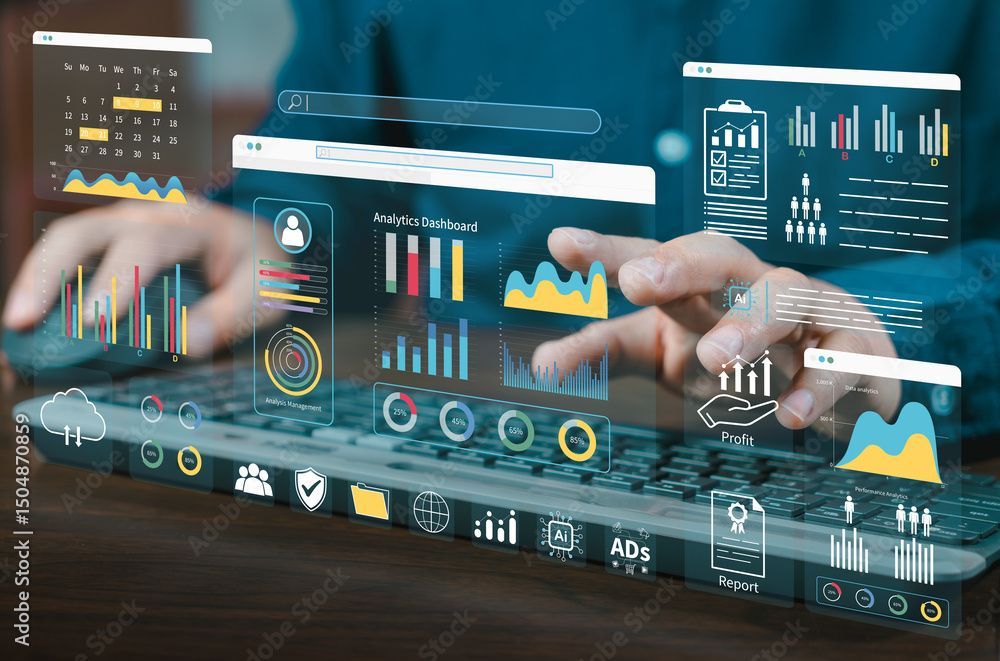
A well-designed dashboard is not just a reporting tool—it becomes the control center for the entire operation.
Case Study: Integrated Procurement Overview Dashboard
Over the past projects, our work has shown that a well-designed dashboard is not just a reporting tool—it becomes the control center for the entire operation. For example, when developing an integrated Procurement Overview Dashboard, we centralized everything from supplier ratings to cost distribution in one Power BI interface.
This immediately reduced report preparation time, eliminated manual consolidation errors, and gave management a clearer picture of where performance was improving—or slipping—at any moment.
Essential Procurement Indicators
To make insights easier to understand and act on, we structured the dashboard around a few essential procurement indicators:
- Supplier Performance Visibility – enabling targeted engagement with high-impact suppliers
- Spend Tracking by PO Type & Region – supporting tighter cost control and budget alignment
- Buyer-Level Spend Monitoring – improving accountability and purchasing discipline
- Return-to-Supplier Insights – clearly showing quality issues and operational bottlenecks
- Late Invoice Tracking – helping finance anticipate delays and maintain strong supplier trust
Building Consistency Across the Organization
Consistency also plays an important role in building a mature analytics culture. Many companies face confusion simply because dashboards vary widely from department to department. To address this, we created a standardized Power BI template—a reusable design system that included company colors, typography rules, logo placement, and layout principles.
With this template, every future dashboard across the organization followed the same visual identity and analytical structure, making cross-department reporting easier and significantly more professional.
From Development to Ownership
But a dashboard's true value depends on its users. That is why our service doesn't stop at development. We provide structured training and handover sessions to ensure that your team can update, maintain, and expand the dashboards confidently on their own.
This upskilling component often becomes one of the strongest long-term benefits for clients, transforming dashboards from a one-time project into a sustainable analytical capability.
Beyond Procurement: Analytics for Every Function
While procurement dashboards demonstrate the power of structured analytics, SBI's capability extends across all business functions. We've built dashboards for:
- Finance: Cash flow projections, budget variance, AR/AP aging
- Operations: Production efficiency, asset utilization, downtime analysis
- Sales: Pipeline visibility, conversion rates, customer segmentation
- Supply Chain: Inventory turnover, delivery performance, logistics costs
- HR: Workforce analytics, training completion, turnover trends
The SBI Approach to Data & Analytics
Our approach always starts with understanding your specific needs—not imposing a template. We work closely with your team to:
- Identify the key decisions you need to make
- Determine what data would support those decisions
- Design dashboards that are intuitive and actionable
- Establish data governance and refresh schedules
- Train your team to maintain and evolve the solution
The result is not just a dashboard—it's a foundation for data-driven decision-making that grows with your business. When executed properly, analytics becomes your competitive advantage, helping you spot opportunities faster, respond to challenges earlier, and operate with confidence backed by facts.
In a world where every company has access to data, the winners are those who can turn that data into action. That's where SBI makes the difference.